
What is the best way to keep an eye on the progress?
Do you sometimes feel you aren’t going anywhere and can’t see any progress in the areas you want to keep developing? Don’t worry, it’s entirely normal and I feel like that very often. However, I have found a way to make me feel a lot better, and it’s proven to get myself doing more than I was doing earlier. This naturally leads to faster progress, since doing is the best way to learn and improve your current abilities. So, what is it that I’m talking about? It’s like the classic tip “write down your goals”, but in steroids. You have to make it visual!

I got this idea from the best-seller book Atomic Habits written by James Clear. He describes perfectly how constant work adds up to great results, when they are planned, tracked and reviewed. If this got your attention, I really recommend reading his book (after reading this post of course). Several years ago I wanted to start learning languages while I was killing my time at home. Playing Duolingo really felt nice and I played a huge amount of time in the first few weeks. Then I kind of got bored of it. I completed just one lesson everyday to keep my streak going (never let go of your streak!), but it didn’t really have anything to do with learning. I really wanted to learn Spanish, but I wasn’t ready to do anything to get there. I had the same problems with few of my books. Then I remembered the advices from James.
I tried to write down my goals first, but it just felt stupid. Why would I write something down? I already know what I want to do. To learn Spanish and complete my unfinished books. Then I remembered the other advice, that says breaking down the goals to many smaller goals instead. I set my self a target for the next weeks. I would need to read 50 pages per week and complete 1 unit of Duolingo per week. This made me so excited, that I read like 95 pages in the first week and completed 2 units of Duolingo. I felt I was on fire and I found my way to unlimited success! Then came the second week, which was efficient, but not as efficient as the first one. After those two weeks I was in the same situation as before writing down my smaller goals. There wasn’t any pressure to keep me going.
After a while, I don’t remember anymore where, I got an idea to make an Excel-sheet about my goals. First it was a classic Excel-file with huge amount of stuff but nothing really important. Then little by little I got it to work the way I wanted. I tried to find something very special with the Excels commands, but what I actually needed and where I finally ended up was something much simpler. I made one sheet with charts. Then I made two more sheets, one for language learning and other for books. The charts were just to visualize the progress, while these other sheets were for data about my goals. The data is very simple. There is goal and result for every week plus a completion rate.
For example in the books sheet, there could be a goal to read 50 pages per week, and if I end up reading 43 pages, my result is -7. Let’s say the book has 430 pages in total, so my completion rate would be 10 % after this week. However it should be 11,6 %. The line chart (or whatever chart style you prefer) visualizing the books would now show the actual completion rate and the target completion rate of this certain book. And naturally if the actual completion rate is below the target rate, you are falling behind. I have found this to be the extra push that I need to get the missing amount of work done. I fill this Excel every Monday to review my previous week and to plan my upcoming week.
Below is a screenshot from my Excel-sheet, where I have input my data about language learning. I had been doing those Duolingo courses for a while, so that’s why they start with so high completion rate already. I started Mondly German just recently, so it can’t be seen in this photo. This current sheet is very wide, and it may be better to do own sheets for every year. For example these weeks are from 2023, so there is already quite a lot of columns of data here which maybe isn’t so practical. I have divided part of the courses to units, according to the apps. This is just to make it easier to follow the completed amount of units. If I have just completed the unit 15 of the phase 4 of Duolingo German, I can just count my progress to be the number of units in phases 1-3 + 15. I recommend you to make an Excel-formula for calculating progress of each course to save time.
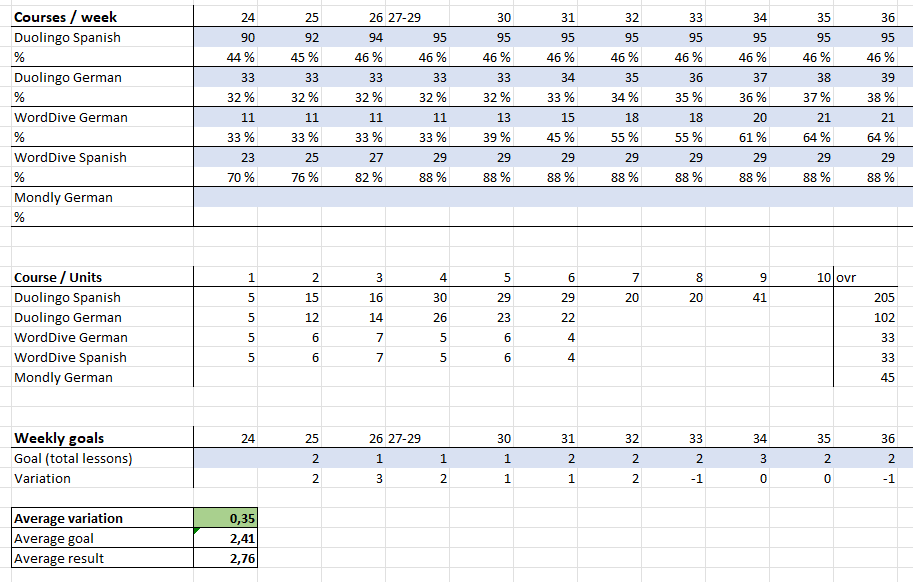
On the weekly goals I input the amount of units/lessons I need to complete during the upcoming week. So if I’m reviewing the progress of the week 8 on Monday of the week 9, I will naturally add the Goal for the week 9. There isn’t a goal for the week 24 in the photo above, because it’s the starting level. There is also weeks 27-29 in the same column, since I had a three week vacation and decided to relax a little 🙂
The variation calculates the difference between the completed lessons and the goal. You can see in the photo, that I completed 3 units on the week 31 (the difference between weeks 31 and 30), and I had the goal of 2 units, so the variation is +1. Below the weekly goals are the indicators of average completion. There is the average of the variation, which in this photo means that I on average I do 0,35 units more in a week, than what my goals are. When this is positive, you are doing well. If it’s negative, you are falling behind.
Make it visual to really feel the progress
I think this doesn’t seem to be too fascinating yet, but we have just covered the data that we need to collect. Where I’ve really seen my motivation and consistency to increase, is to see the progress visually. In the beginning the amount of data is small and the progress is still hard to see, but when the Excel-sheets are consistently filled, the progress is starting to create nice visuals. Below is my language chart to visualize how much I’ve learned.

I have used this chart now for eight months, and it starting to really show my progress. It also shows my not-so-good progress in Duolingo Spanish during this time. There you can clearly see, when I switched from learning Spanish to learning German during the weeks 29-30. I needed German for my upcoming studies, so I can defend myself for not just giving up on Spanish for nothing 🙂
It’s important to acknowledge that every course has a different amount of units/lessons, so percentual comparison doesn’t tell anything about the number of those courses. For example Duolingo Spanish is little bit below 50%, but there are 100 completed units, whereas Duolingo German is at 70%, but it has “only” 71 units completed. So that flat line of Duolingo Spanish isn’t as bad as it first seems. I still need to pick up the pace there though…
In the end it’s up to the user to make the decisions on how they want to visualize their progress. For me it has been the best manner to use completion rate, so the charts are useable for multiple courses and there is really a goal to achieve at the top (100%). If you know your goal is to read 50 books, you can just add the number of books and compare it to your goal of 50 books manually. In this chart I also want to point out, that I don’t use lines to compare my progression to my goals like I mentioned earlier. I feel it’s not visually nice in a chart like this following multiple progress lines at the same time. I do the comparison with the indicators mentioned above.
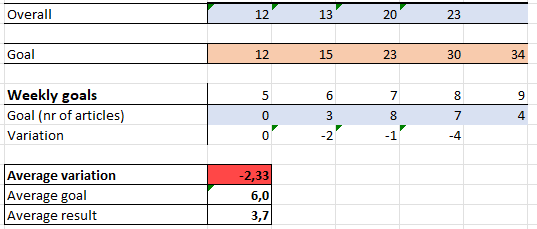
Below is another chart that I made to get myself reading enough articles for my Master’s Thesis. Here is the overall number of articles read and the goal that I have set for each week to visualize if I’m ahead or falling behind. This isn’t going so well as you may see. But I have still read twice as many articles per week than before I started using this chart. Which leads to another important point, that is realistic goals.

You can do and follow the Goal-chart by just adding up the weekly goals you have input in the data sheet. Here in the photo below the starting point is 12, so it should be added up with the goals. As you may have guessed, I tried to complete articles without this Excel-sheet for a month and I only got to 12 articles.. 🙂
Too high expectations don’t get you where you want
Like I told above, I may have used unrealistic expectations for reading articles. It’s kind of obvious, that if I have read 100% more articles per week, but I still fall behind from my goals, they are too unrealistic. I find myself doing this quite a lot in subjects that I’m not really familiar with. Too high expectations usually kill motivation very quickly, so it’s not good to get used to using them. But! I have also found a solution for making these goals at least a little bit more realistic.
If you have a clear goal in mind, let’s say you want to read every Harry Potter book during the next year. Just divide the total amount of pages there are with the number of weeks in a year. There you have your average weekly goal of pages to read. After a few weeks you can see if that goal was realistic, when you fill out your own Excel-sheet or other kind of tool. If you are falling behind from your goals just a little, but you feel like you have had very busy weeks for this time period, you can maybe give these goals another chance and try to compensate the results on the easier weeks. If you are falling behind while having fairly easy weeks and you feel like you have really put in the effort, your goals are clearly unrealistic. Or, if the goals always feel like impossible to achieve, they are unrealistic for sure.
Also on the other hand if you are constantly doing much better than your goals, they might be too low to really push yourself forward. Although this isn’t so big of a problem, since you are clearly doing at least some kind of a progress. Sometimes it’s very wise to do a bit more during the easier weeks, so you reduce the pressure from the busier weeks in your like. Experiencing different goals really tell you your limits.
It’s really important to find the balance with your goals and your realistic achievements. For example in my language learning charts, it sometimes feel kind of dumb to add 1 unit per week as it doesn’t really seem like a good progress. But in this pace, after a year it’s already 52 units, which for me sound like a really good progress! I hope you got some good ideas for yourself from this post, and if you’re interested, I’m more than happy to help you with the development of your own Excel-sheets. Thank you for reading!

Leave a comment